

Splitting the Check: Rethinking Local Property Taxes

By Junia Howell | November 28, 2023
4 minute read
How do you split the check? If you are anything like me, how I split a check is highly dependent on the details. Is it for work or pleasure? Did everyone partake? Does everyone have the ability to pay? Were people invited under the pretense their cost would be covered?
The seemingly straightforward calculation can become quite complicated, quite quickly—even when you are only splitting a few drinks between friends. It’s even more complicated when you are splitting essential services like trash pick up, sewage lines, and public schools between neighbors.
We don’t often think about property taxes as ‘splitting a check’ with our neighbors but the process of how we divide up the cost of municipal services evokes many of the same questions as splitting a dinner bill.
Is your property a company or personal residence? Did all the neighbors equally partake? Does everyone have an ability to pay? Were some neighbors promised a reduced bill due to their age, income, or a service they provide to the community?
County auditors have the unenviable task of answering these questions and divvying up the bill. Unfortunately, the primary method used by most auditors has been repeatedly shown to overtax people of color and lower-income property owners. High tax bills in communities of color and lower-income neighborhoods reduce housing affordability and lead to increased tax lien sales.
Deriving A New Approach
This summer, we began working on developing our alternative approach, essessments—or equitable tax assessments. After only a few weeks, Hamilton County (Cincinnati), Ohio’s auditor graciously agreed to meet with us and provided their new, unreleased assessments to begin testing our interventions.
We dove right in.
Our first observations confirmed existing scholarship—the racial and class inequities in tax assessments were not only present but increasing over time. Yet, we quickly discovered we had a lot to learn about the mechanisms driving the inequality.
To be honest, we still do. We are still in the midst of uncovering exactly how the existing methods perpetuate inequality and the most effective ways to address the injustices. But along the way, we are seeing more clearly how unequal our current approach is.
For example, households in Hamilton County, Ohio whose annual income is less than $25,000 spend a startling 20 percent of their income on annual property taxes. Conversely, households who make more than $150,000 a year spend less than 2 percent of their income on property taxes.
Put another way, the lowest income families are paying ten times more of their income on property taxes than the wealthiest families.
Figure 1. Proportion of Household Income Spent on Annual Property Tax
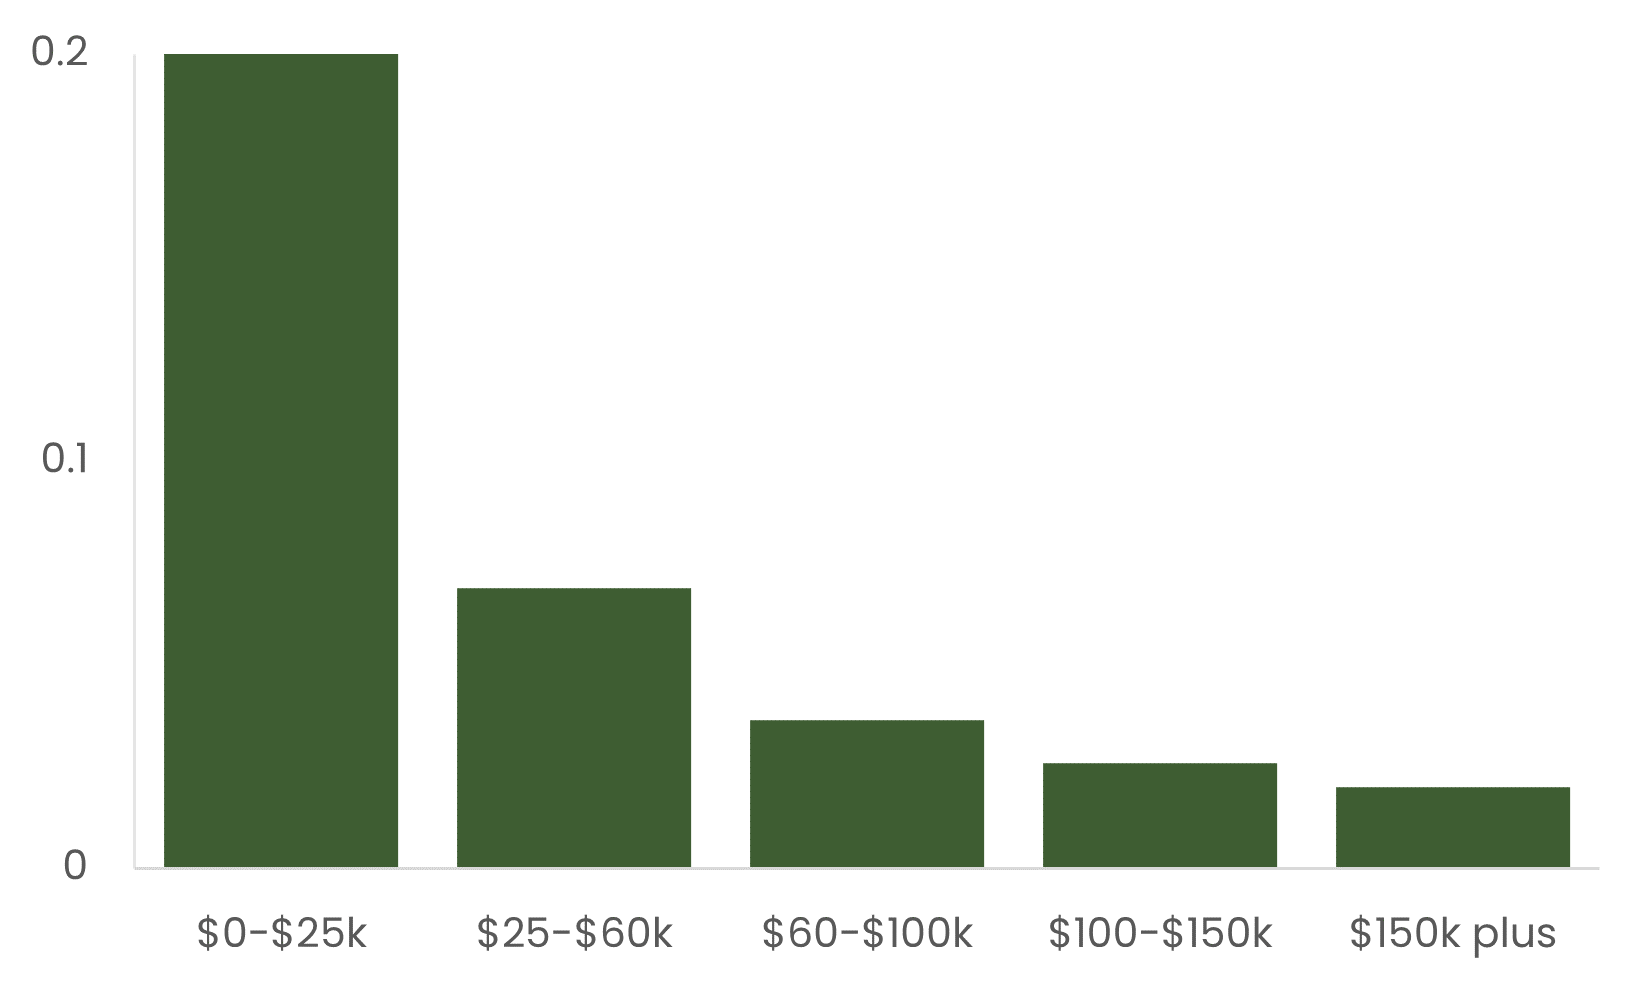
Data from Hamilton County, Ohio 2022 Tax Records and the American Community Survey (ACS).
Granted, property tax is often not compared to income because it is seen as a ‘wealth’—not an income—tax. That is, annual property taxes are often justified by the fact that owners can sell their properties for a profit, increasing their wealth.
So, we were curious…are people who are making more money off their properties paying more in taxes?
First, we calculated how much owners gain in property sales by looking at the difference between what they sold the property for and what they bought it for. We then divide this by the number of years they owned the property to derive an average annual appreciation. Finally, we calculate how much of the wealth gained is paid in taxes.
We find households whose properties appreciate, on average, less than $1,000 a year pay 170 percent of their home wealth in property taxes. In other words, they pay considerably more in property taxes than they gain in home appreciation. Conversely, properties that appreciate more than $25,000 a year pay less than seven percent of their home wealth in property taxes.
Figure 2. Proportion of Annual Home Appreciation Spent on Property Tax
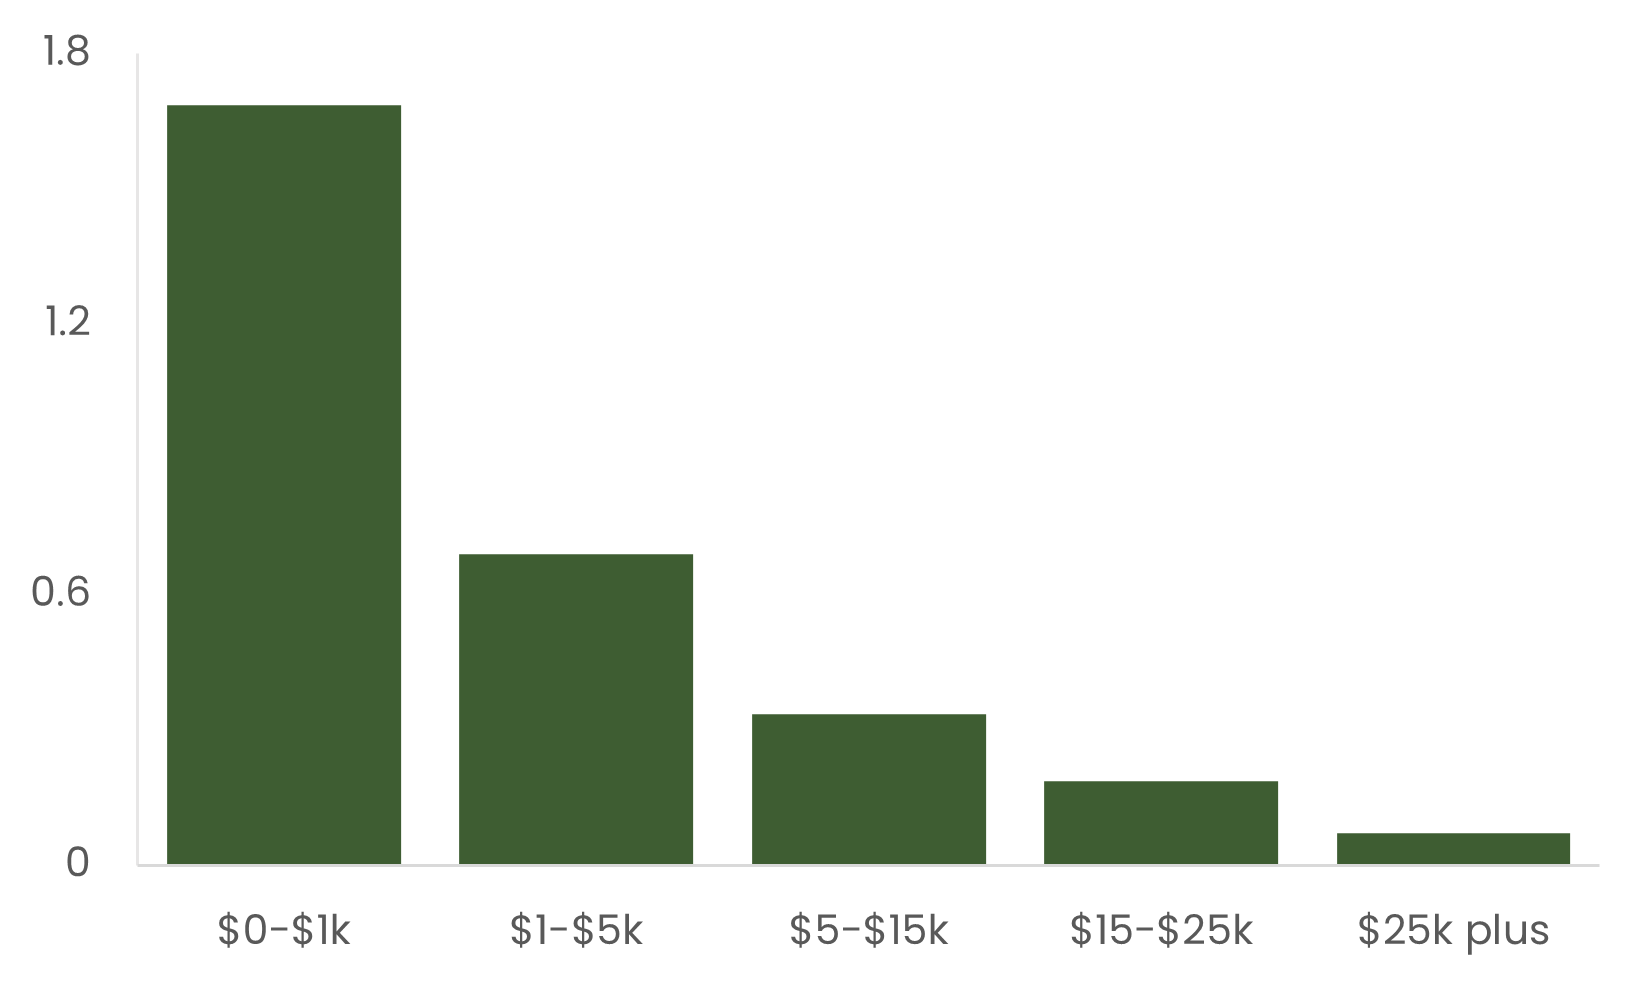
Data from Hamilton County, Ohio 2002-2022 Tax Records.
To put this in perspective, 30 percent of Hamilton county homeowners spend over 70 percent of their home appreciation in annual property taxes. For these homeowners, their tax burden is eliminates or significantly reduces the financial benefits of homeownership.
Clearly, how we are currently ‘splitting the check’ for municipal services is far from equitable or just.
We currently have four alternative approaches to calculating tax assessments that we are evaluating along four matrixes of equity. This analysis will help us refine and propose a comprehensive approach to reconfiguring who is invited to the table and how we will split the check.