

How Fair Are Your States’ Property Taxes?
By Junia Howell | May 28, 2024
6 minute read
For decades, scholars have demonstrated that people of color and lower income residents pay more than their fair share of property taxes.
At the beginning of the 20th century, local governments across the nation deliberately manipulated property values and rates to ensure residents of color and those with less income would pay higher taxes. (If you want to learn more about this history, check out Andrew Kahrl’s new book, The Black Tax: 150 Years of Theft, Exploitation, and Dispossession in America).
Over time, some of the overtly racist techniques were outlawed, but they were quickly replaced with new approaches that reinforced and even exacerbated the inequity.
Our latest research shows that contemporary inequality stems from (1) biases in the computer programs that estimate property values and (2) outdated assumptions regarding property values.
Both are critical and need to be addressed, but the latter is driving more of today’s property tax inequities.
Property Values As A Proxy for What?
In the 17th and 18th century, Colonialist governments used land value as a proxy for settlers’ earnings, wealth, and power. This system assumed settlers with more vast and fertile land could produce more crops (i.e., income), sell their land for steeper profits (wealth), and dictate development (power).
As society industrialized, land value alone was no longer a good catch-all system for estimating residents’ resources. Governments added income and other taxation approaches, but every state in the nation has kept property tax.
We no longer think of property tax as a proxy for the crops you can produce, but we do think of it as a wealth tax. We assume those with the most means are paying more property tax. Our latest research, however, shows this assumption is false.
The Poor Pay More
There are lots of ways to measure who has more wealth and power: income, investments, property appreciation, access to quality amenities, etc. In eruka’s recent deep-dive into Hamilton county (Cincinnati), Ohio’s property taxes, we used multiple measures that all produced the same result: those with the least are paying a higher tax rate than those with more. Income was the most dramatic of all measures (and likely the most consequential for residents’ daily finances). So we decided to investigate how much people across the country are paying in property tax relative to their income.
Figure 1. Proportion of Household Income Spent on Annual Property Tax, 2022
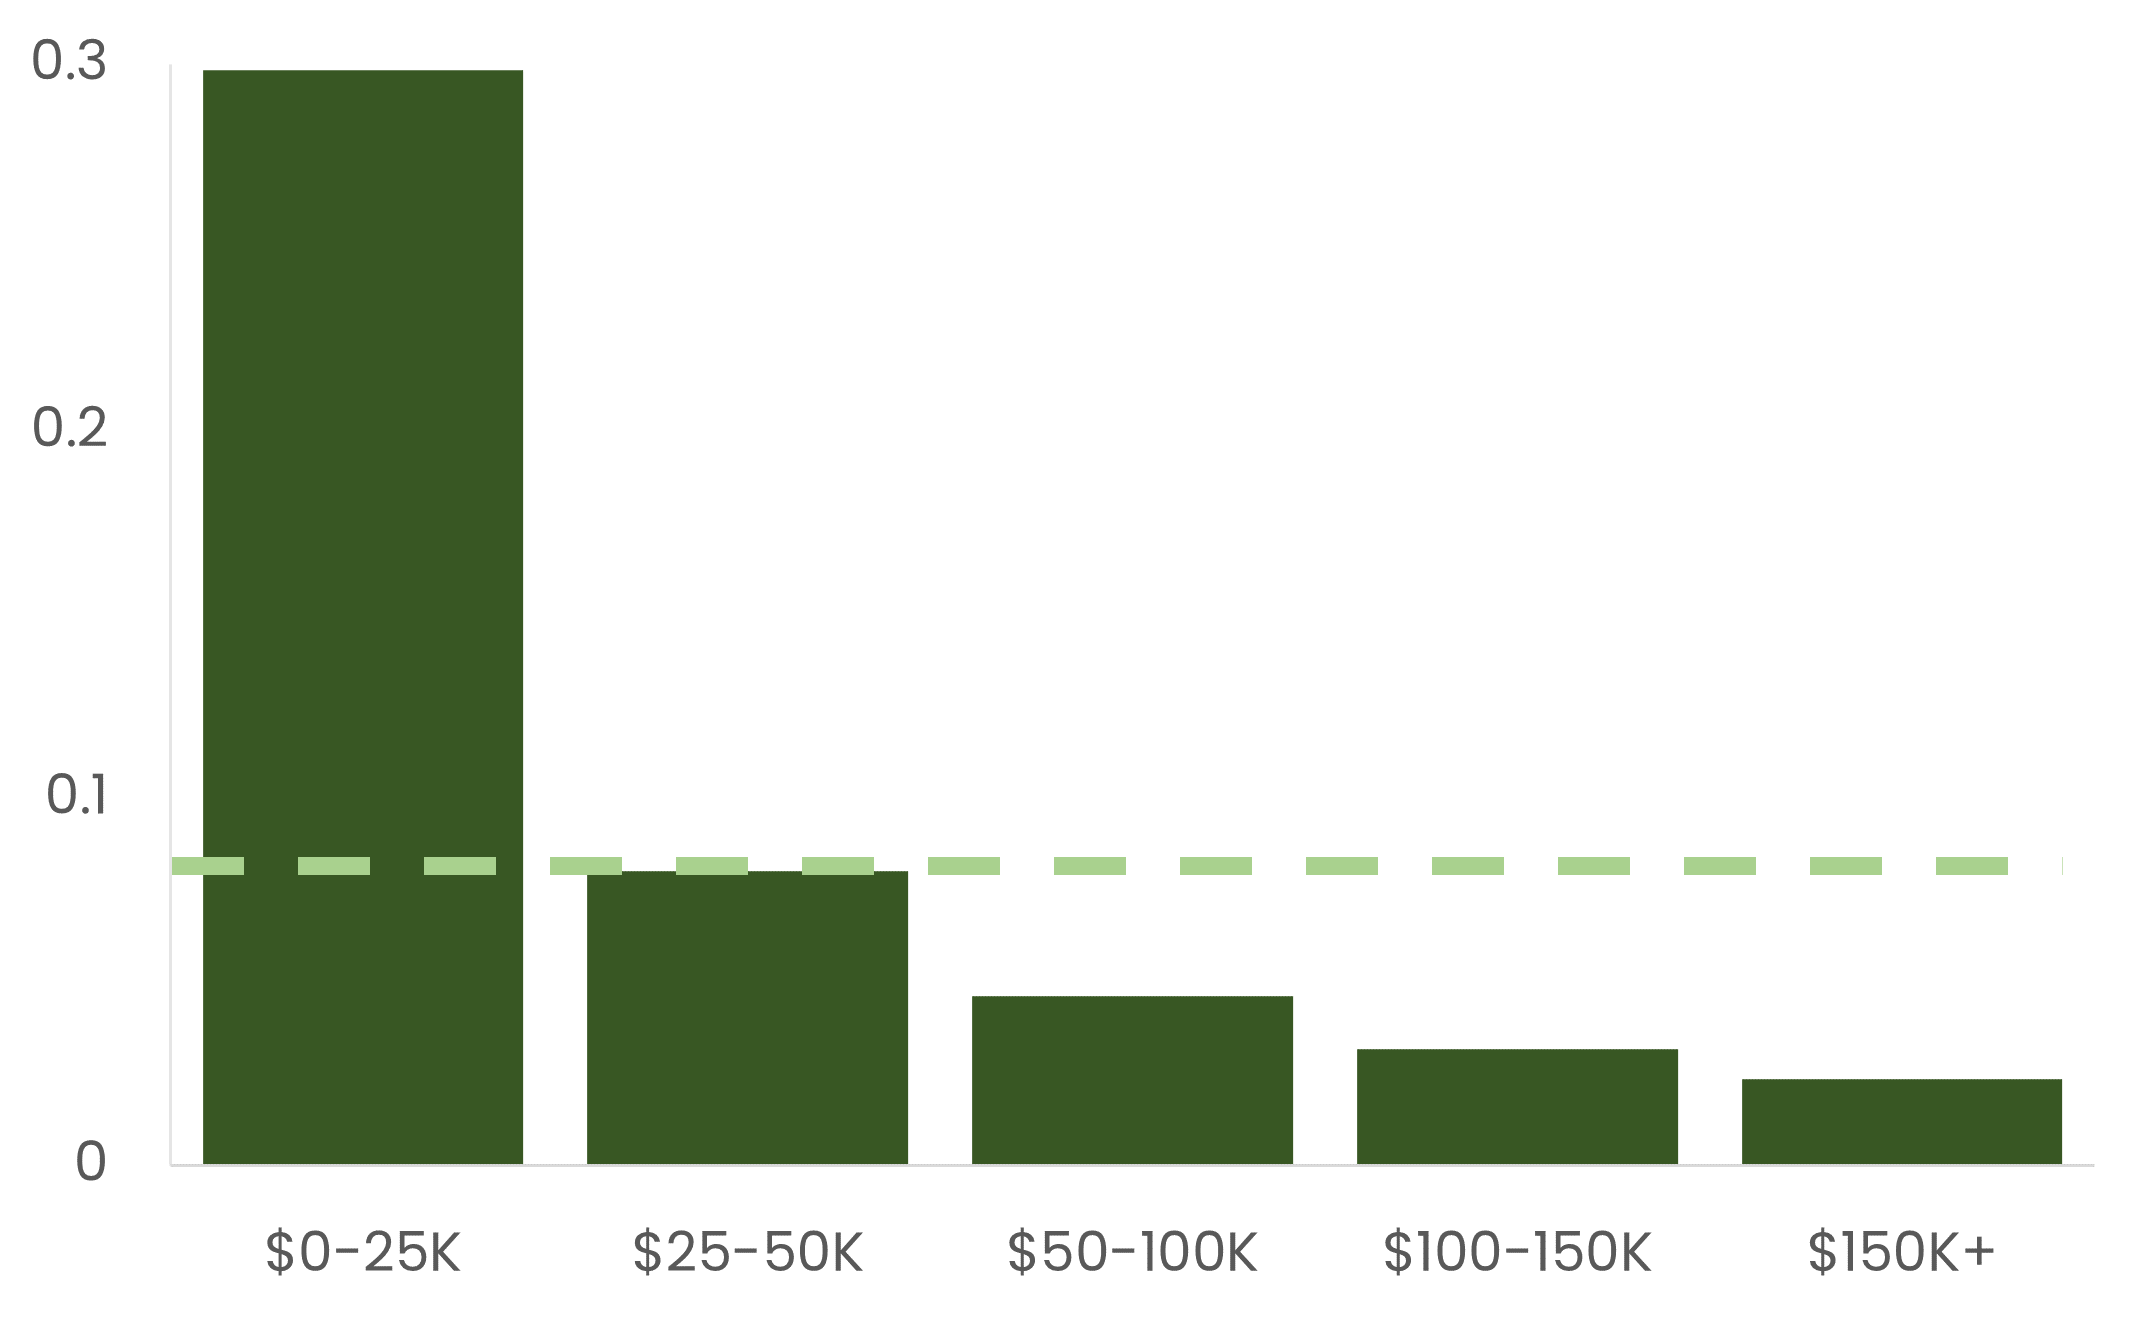
Data from the American Community Survey (ACS) 5 year summary files for census tracts.
In 2022, the average U.S. household making less than $25,000 annually spent a staggering 30 percent of their income on property taxes. Families in the middle of the income distribution (making between $50,000 and $100,000 annually) spent 5 percent of their income on property taxes, while those on the top of the income distribution (those making over $150,000 annually) spent only 2 percent of their income on property taxes. Across all the income categories, the average U.S. resident spent 9 percent of their income on property taxes.
What if we collected this same amount of tax dollars another way?
If we used a flat tax rate (everyone pays the same percent of their income), US residents would only have to pay 4 percent of their income.
If we used the federal progressive tax brackets, the average resident would only have to pay 2 percent of their income in property taxes. For the poorest families, this would reduce their tax burden from 30 percent to 1 percent of their income—dramatically increasing the money they could use for food, utilities, healthcare, and other essential needs.
But What About Your State?
Although property tax is regressive nationwide, not all places collect the same amount of tax or have the same level of inequity. Generally speaking, states in the Northeast pay the largest percentage of their income on property taxes while those in the south pay far less.
Table 1. State Mean Percentage of Household Income Spent on Annual Property Tax
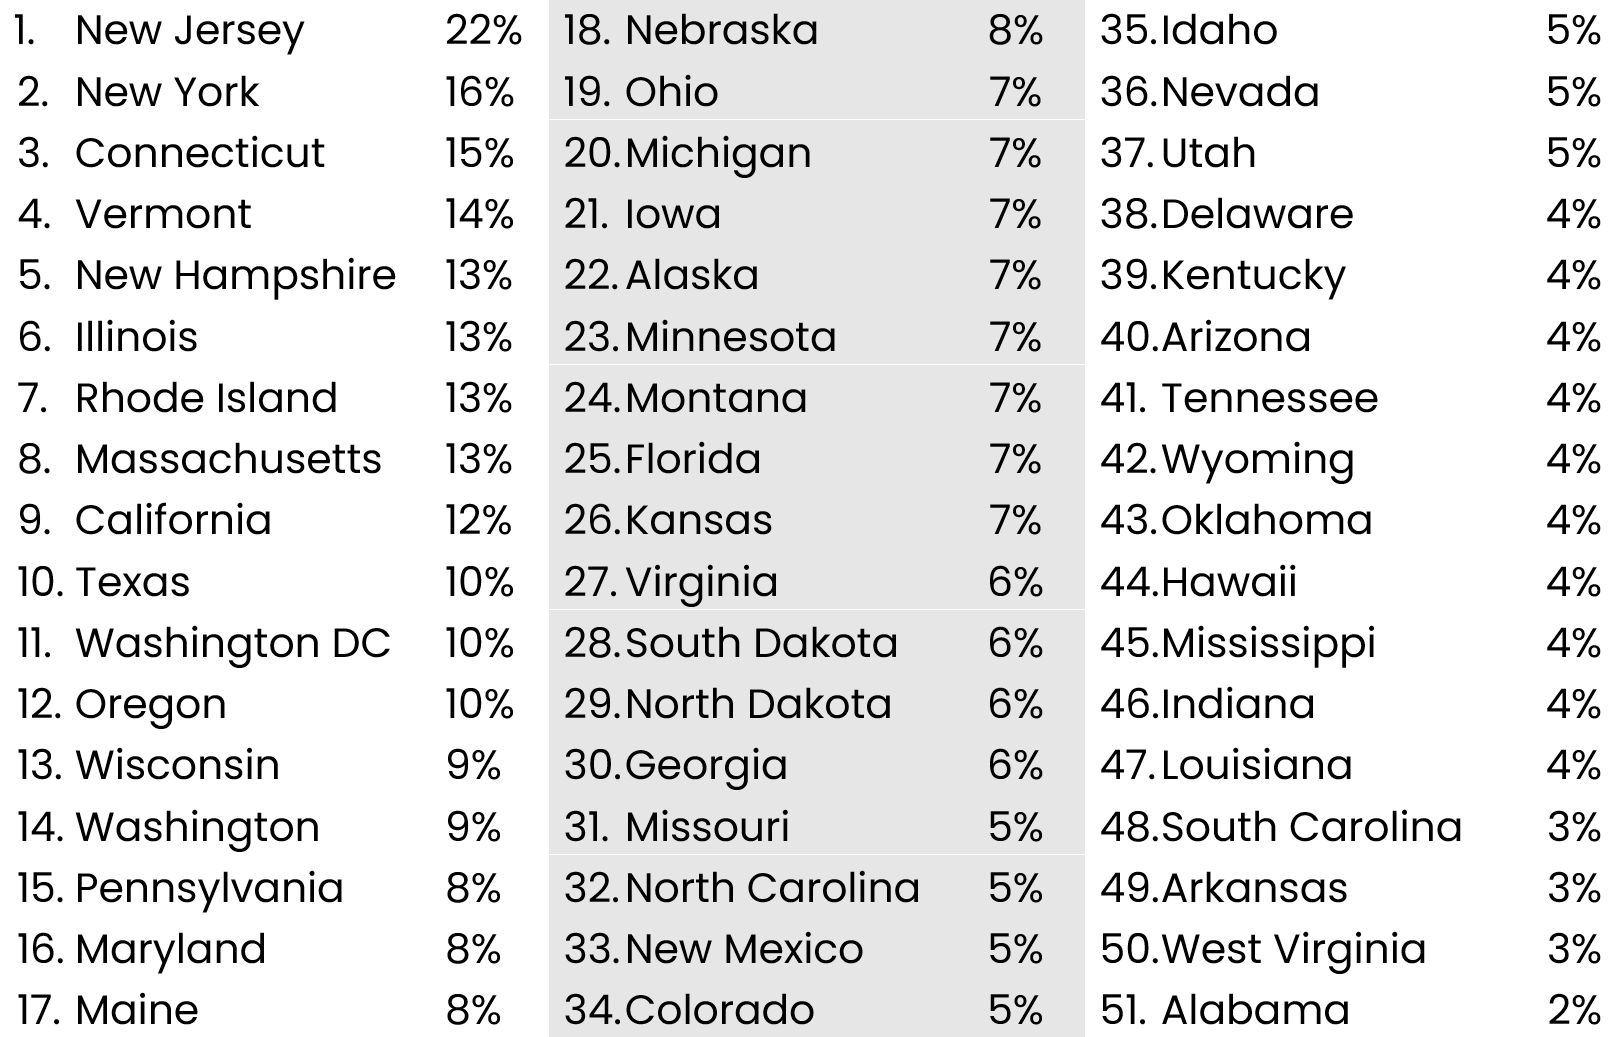
Data from the American Community Survey (ACS) 5 year summary files for census tracts.
The dramatic difference between the proportion of income New Jersians and Alabamians’ spend on property taxes is due to three factors: (1) how much the local government spends on services, (2) how much the state relies on property taxes compared to other revenue sources (e.g., sales tax), and (3) how much of the property tax load is carried by the poor rather than the rich.
With the data we currently have, it is hard to distinguish between the first two factors. We know which states collect more money in property taxes (i.e. New Jersey collects $10,000 per household and Alabama collects $800), but we don’t know if that is because New Jersey provides more services to its residents or because New Jersey uses property taxes more than other forms of taxation. Of course, the truth is likely a mix of both.
Yet, our data does allow us to separate out the third factor—to what extent higher proportions of income spent on property taxes is due to the state overburdening the poor. To figure this out, we did a little experiment.
First, we assumed all states collected the same amount of property taxes per household ($2,500, the national average). Second, we used the state’s actual distribution of tax burden across income categories to distribute this fictitious amount of taxes. Third, we calculated how much the poorest category (those making less than $25,000) would now spend on property taxes.
This little experiment allows us to eliminate differences in how much the states collect in revenue and just focus on how much they overtax the poor. Using this apples-to-apples comparison, we see that states like Vermont and Hawaii have the highest over-taxation of the poor while states like Virginia and Ohio have the least.
Table 2. Percentage of Income Spent on Property Tax for Households Making $0-25,000
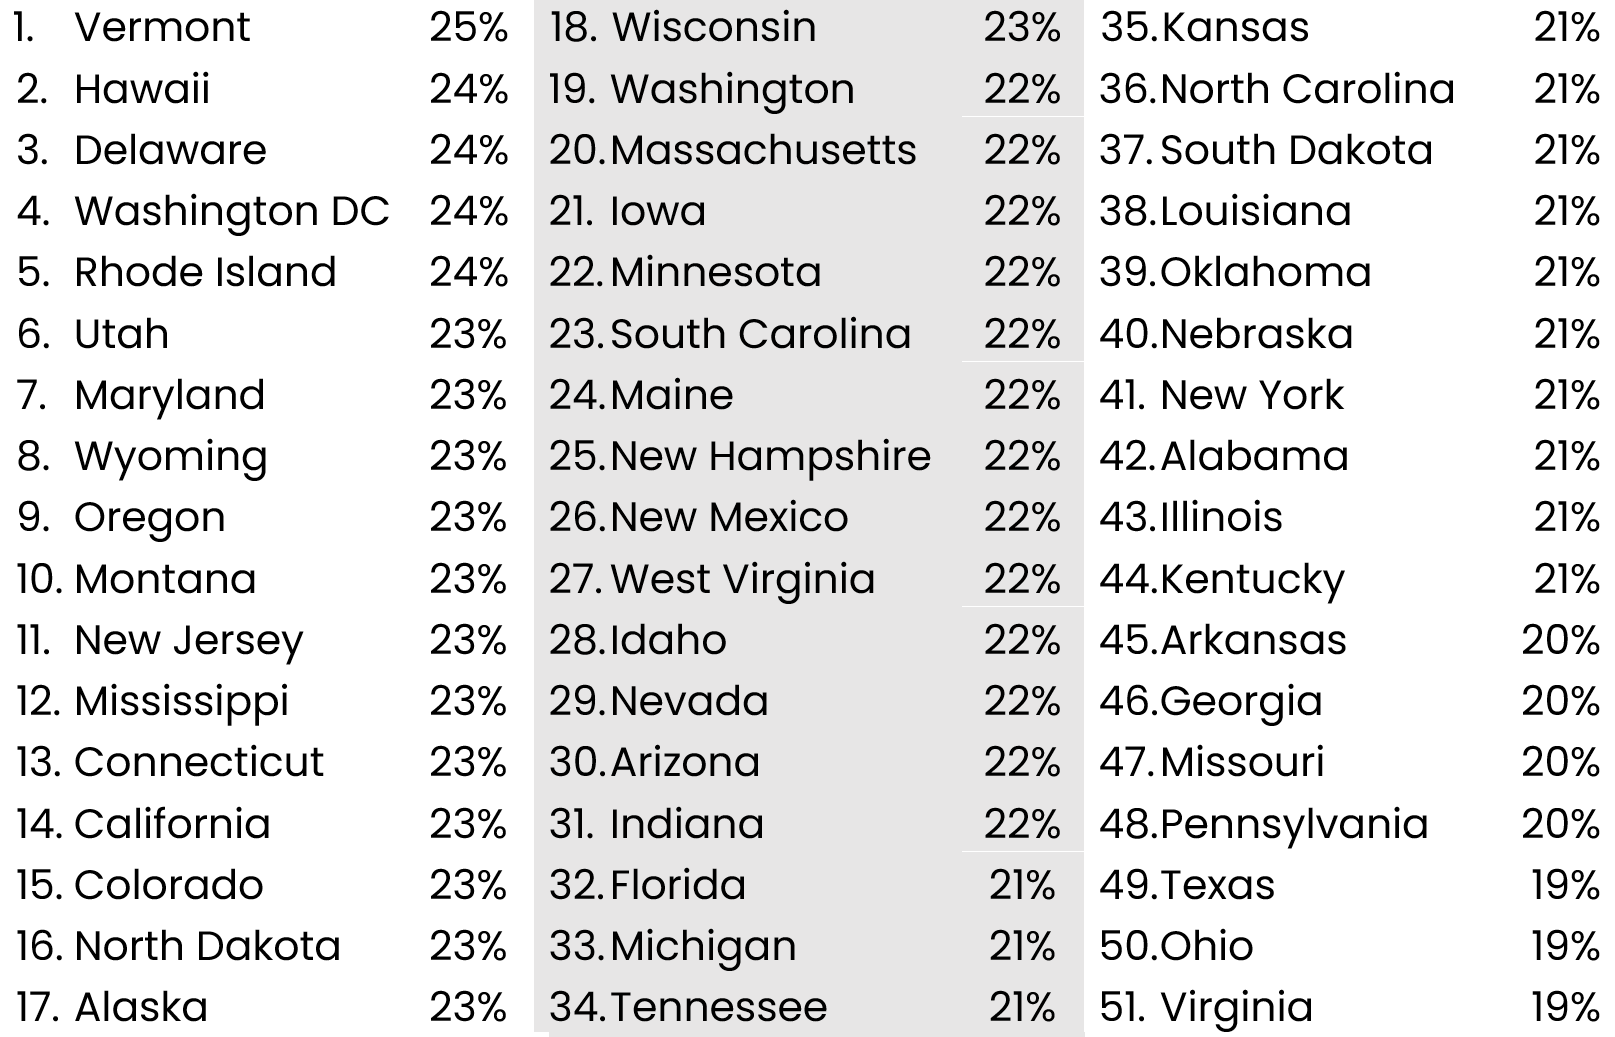
Data from the American Community Survey (ACS) 5 year summary files for census tracts.
What this experiment also shows us is that all states are severely overtaxing their poor. Even in Ohio and Virginia, the poor are paying ten times more of their income in taxes than the rich.
No matter where you live, property taxes are disproportionately carried by those with the fewest resources, contributing to the growing housing affordability crisis and inequality more broadly. At eruka, we know better approaches are within reach, and we are working with local officials to implement changes. If you think your community might be interested in making your taxes more just, let us know. We are looking for partners willing to innovate transformative solutions.